Charts
Charts text and number values
Input file template.docx: 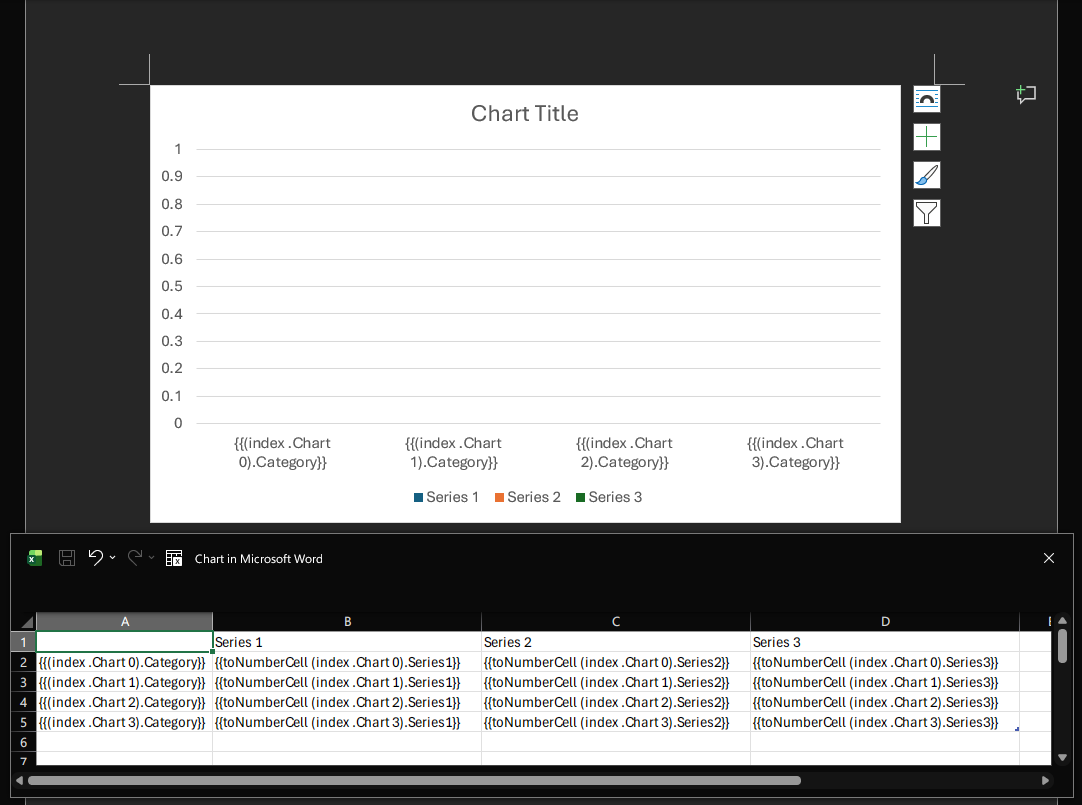
toNumberCell
The toNumberCell function is used to make the cell type equal to number, this will make the chart evaluate a graphic representation of that numeric value.
Golang code:
go
package main

import (
	"fmt"

	gotemplatedocx "github.com/JJJJJJack/go-template-docx"
)

type ChartData struct {
	Category                  string
	Series1, Series2, Series3 int
}

type ExampleStruct struct {
	Chart []ChartData
}

func main() {
	docxTemplate, err := gotemplatedocx.NewDocxTemplateFromFilename("template.docx")
	if err != nil {
		fmt.Println("Error loading template:", err)
		return
	}

	templateValues := ExampleStruct{
		Chart: []ChartData{
			{Category: "Category 1", Series1: 10, Series2: 20, Series3: 30},
			{Category: "Category 2", Series1: 15, Series2: 25, Series3: 35},
			{Category: "Category 3", Series1: 20, Series2: 30, Series3: 40},
			{Category: "Category 4", Series1: 25, Series2: 35, Series3: 45},
		},
	}

	err = docxTemplate.Apply(templateValues)
	if err != nil {
		fmt.Println("Error applying template values:", err)
		return
	}

	err = docxTemplate.Save("template_output.docx")
	if err != nil {
		fmt.Println("Error saving output file:", err)
		return
	}
}
Output file template_output.docx: 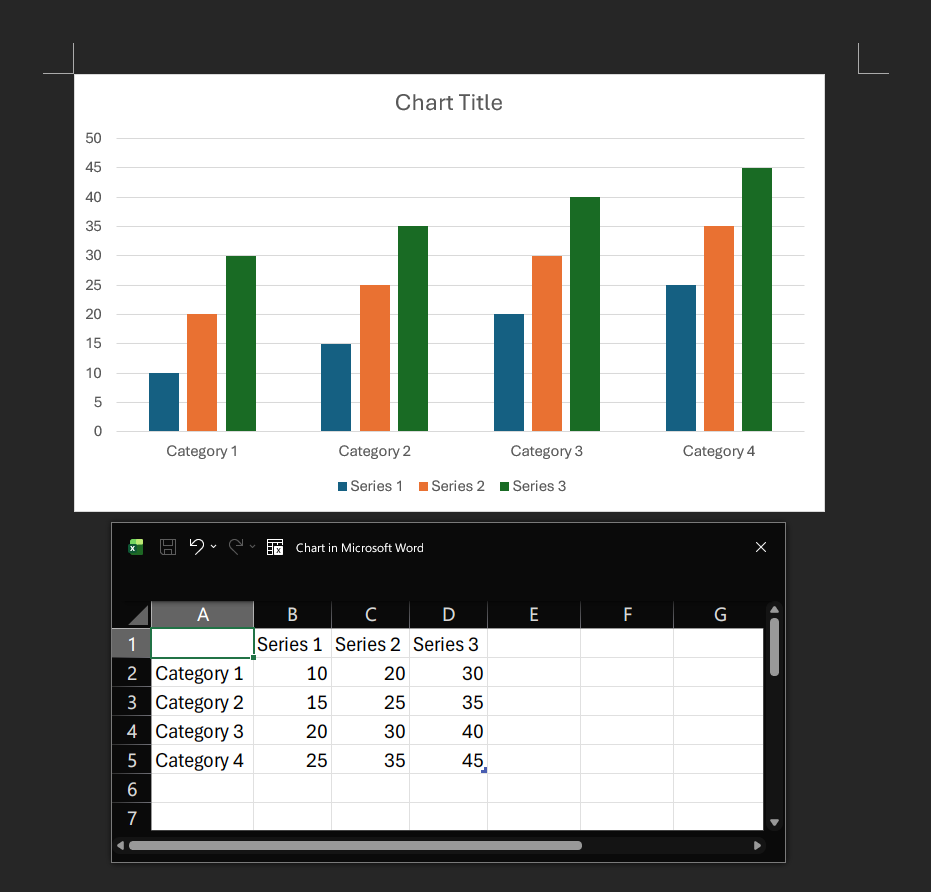
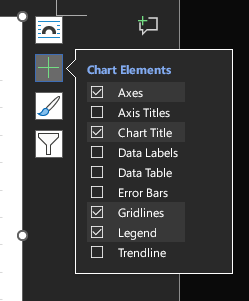
Chart options
You can toggle Chart Elements in the word menu to show or hide elements like Data Labels and such. They will be preserved in the output file.